Welcome! FinWhiz is a free website that watches the same 1,000 most active US stocks every day and explains, in plain words, which way each stock's price has been leaning. This guide walks you through the whole site, one small step at a time. No account is needed to look around — an account only adds your own personal watchlist.
⚠ Not financial advice. FinWhiz is for learning only. A pattern label describes what a price has been doing lately — it is not a promise about what happens next, and it is never a tip to buy or sell. Always do your own research, and talk with a licensed financial adviser about your own money.
1. What the home page shows
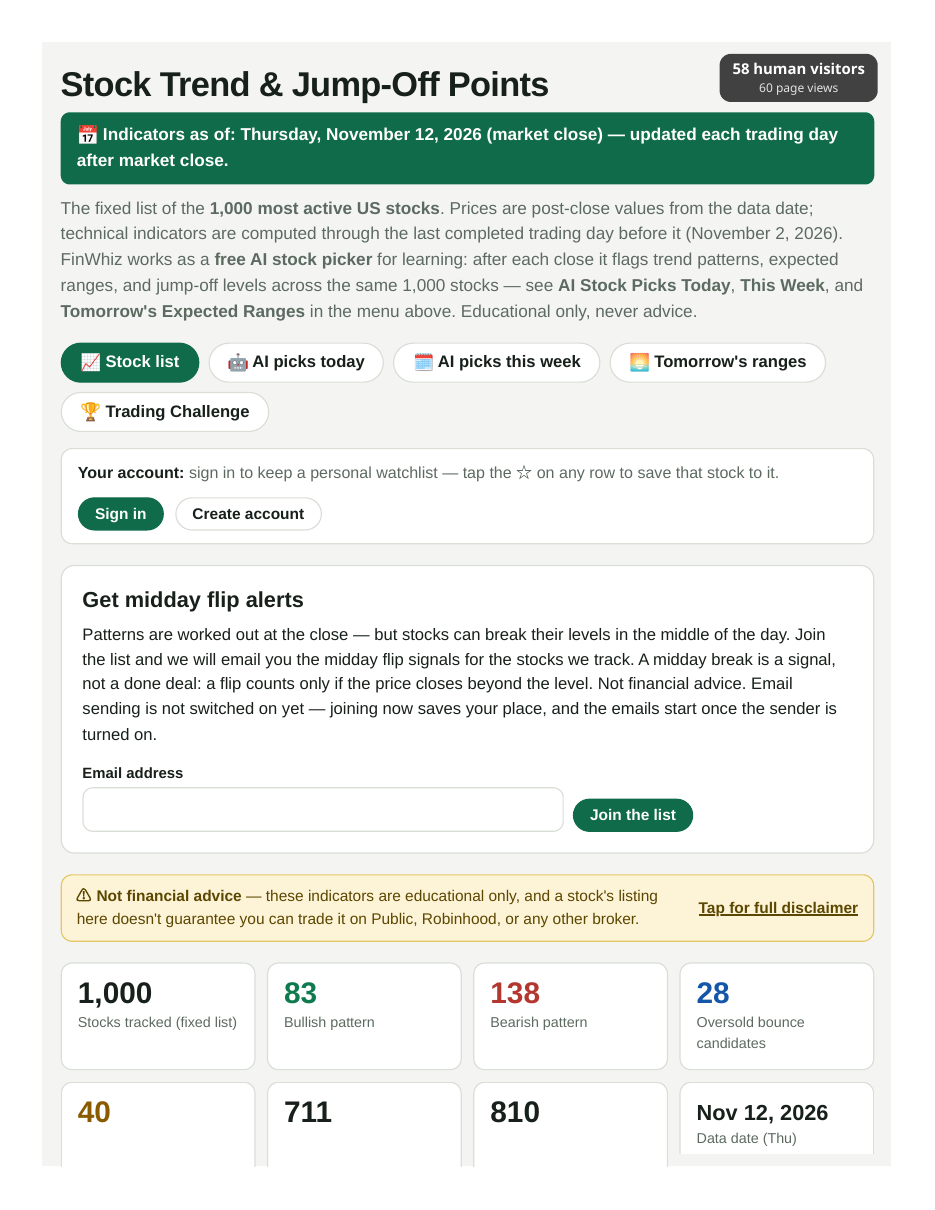
Open finwhiz.us and you land on the Stock list. From the top, here is what you are looking at:
The green date band — “Indicators as of” the latest market close. FinWhiz refreshes after each trading day's close, so the numbers are always the newest finished day, never a half-finished one.
The menu buttons — 📈 Stock list, 🤖 AI picks today, 🗓️ AI picks this week, 🌅 Tomorrow's ranges, and 🏆 Trading Challenge. They switch between the site's views (more on each below).
Your account bar — where you sign in or create a free account to keep a watchlist (section 2).
The midday flip alerts box — a mailing-list sign-up that is coming soon. Joining saves your place; no emails are being sent yet (section 7).
The yellow “Not financial advice” bar — tap it any time to read the full disclaimers.
The count boxes — how many of the 1,000 stocks currently carry each pattern, how many are in the 5+ year group (listed five years or more), and the data date.
The “How to read this page” bar — tap it for the site's own short guide, right on the page.
Search, sort, and filter controls — search by ticker or company name, sort the list, narrow it by sector, or tap a pattern button (for example Bullish) to see only those stocks. There is also a List view / Graph view switch: Graph view draws a small price chart for each stock instead of a table row.
The stock table itself — one row per stock. Section 4 explains every part of a row.
Real screenshot of the FinWhiz home page, taken November 12, 2026. The date and the counts change every trading day, and the page header has since gained the FinWhiz logo at the top — everything else is laid out just as you see it here.
The three “AI picks” views
“Picks” on FinWhiz simply means patterns flagged by the numbers — worked out the same mechanical way for every stock after the close. A flag is never a recommendation.
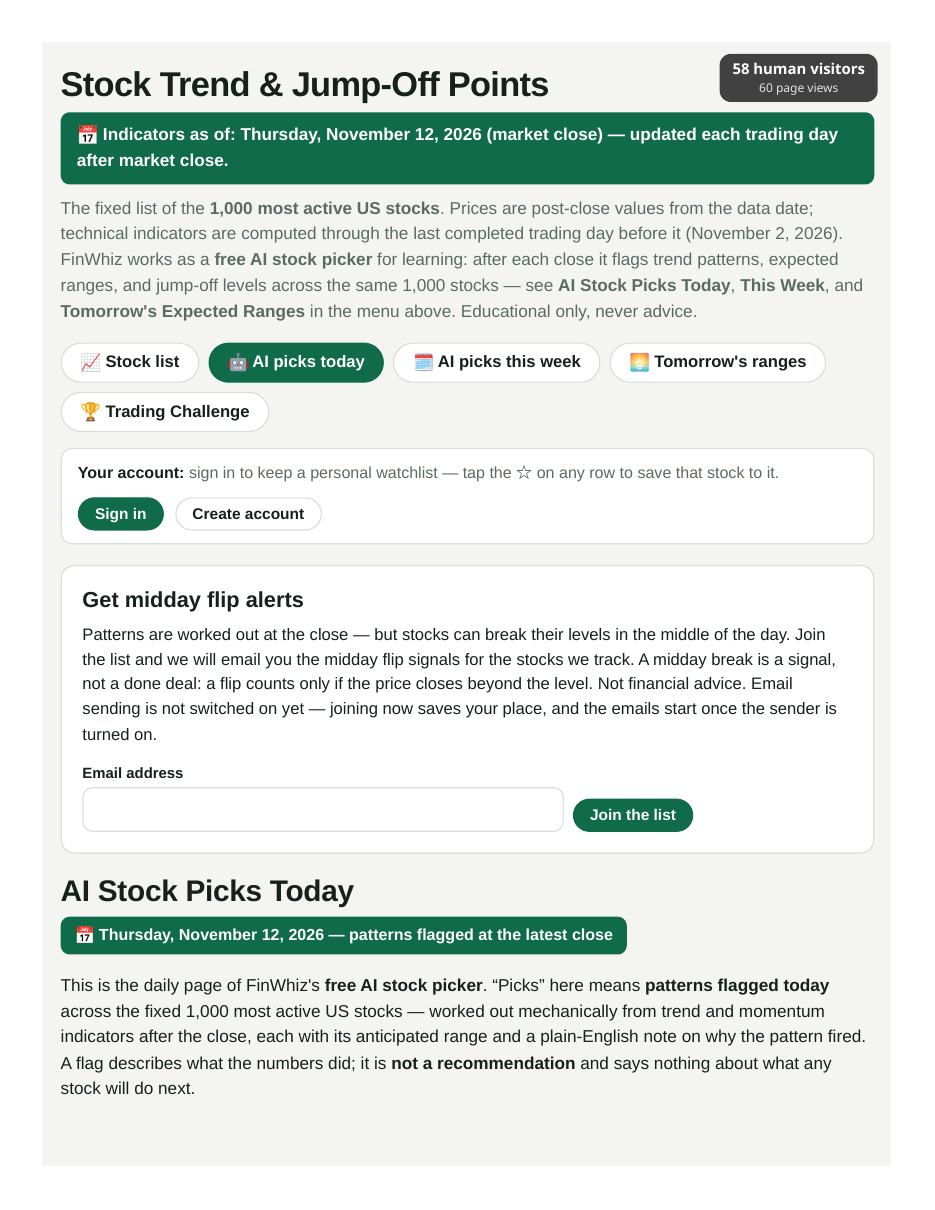
AI picks today — the day's flagged patterns: stocks closest to a breakout, oversold bounce candidates, the strongest bullish patterns, and the day's biggest movers, each with a plain-English note on why the pattern fired.
AI picks this week — the weekly roundup: biggest gains and drops over the last five trading days, stocks closing the week at a breakout or breakdown, and bullish patterns holding into next week.
Tomorrow's ranges — each stock's expected range for the next session. It is a measuring band based on how much the stock usually swings — not a prediction. Prices can and do move outside it.
Real screenshot of the “AI Stock Picks Today” view, taken November 12, 2026 — the same home page with the AI picks today button tapped. Dates and counts change every trading day.
The Trading Challenge
The 🏆 Trading Challenge button opens a friendly practice game: a monthly round where everyone starts with $1,000,000 in play money (not real money) and trades at the latest closing prices from the stock list. There is a public leaderboard, and the month's champion is framed in gold. You need a free account to play, and joining asks you to pick a display name for the leaderboard.
2. Making a free account
An account is free, and it is only for your extras: your personal watchlist and your alert preferences. Browsing the full list works exactly the same signed out.
On the home page, find the Your account bar near the top.
Tap Create account. A small form opens.
Type your Email address *
Type a Password * — pick one you do not use anywhere important, and keep it somewhere safe.
Tap the Create account button in the form.
Watch for the message under the account bar. If it says you are signed in — you are done! If it asks you to confirm, open the email FinWhiz sent to your address, tap the confirmation link in it, then come back and tap Sign in with the same email and password.
* means “you must fill this in.” Both boxes carry an asterisk — the form will not go through with either one empty.
To sign in later, tap Sign in, type the same Email address * and Password *, and tap Sign in. To leave, tap Sign out in the account bar. If the message says your email and password don't match an account, check for a typing slip first — that is the usual cause.
Screen picture — a drawing of the real form, not a photo
Create your account
Create accountCancel
Already have an account? Sign in instead
3. Your watchlist — saving stocks you follow
Your watchlist is your own short list, saved to your account so it is there when you come back.
Adding a stock
Sign in (section 2). If you tap a star while signed out, FinWhiz simply invites you to sign in or create an account first.
Find the stock's row in the list — the search box at the top is the fastest way.
Tap the ☆ star at the left of the row. It fills in and turns into a ★ — that stock is now on your watchlist.
Seeing only your watchlist
Look at the row of pattern buttons just above the table.
Tap ★ My watchlist. The number beside it is how many stocks you have saved.
The table now shows only your saved stocks. Tap the button again to go back to the full list.
Removing a stock
Find the stock's row (the ★ My watchlist view makes this quick).
Tap its filled ★ star. It turns back into an empty ☆, and the stock leaves your watchlist.
4. How to read a stock's row
Every row tells the same story, in the same order. Reading left to right:
Ticker and company — the stock's short code (like AAPL) and the company name, with a 5+ YRS tag if the stock has been listed five years or more. Under the name, some stocks carry a small note about where they can be traded — a listing here never guarantees any broker will trade it, so always check in your own broker's app.
Close — the price at the latest market close, with the company's market cap (its total market value) underneath.
1d % — how much the price moved that day, in green (up) or red (down).
Trend — the pattern badge (explained just below), with the anticipated high or low under it.
RSI — a 0–100 score for how hard a stock has been bought or sold lately. Under 30 = beaten down. Over 70 = overheated. The little bar under the number shows the same thing at a glance.
Bounce-off support — the stock's lowest price of the last 20 trading days: the recent floor where buyers stepped in before.
Breakout resistance — the highest price of the last 20 trading days: the recent ceiling. A close above it is the breakout “jump-off” point.
Expected 1-wk range — the band the price would sit inside over about a week if it keeps swinging the way it usually does (the close, plus and minus its typical daily swing). It is a measuring band, not a target and not a promise — prices can and do move outside it, especially on earnings or news.
Volume — how many shares changed hands that day.
The five patterns, in plain words
BullishTrending up. The price is above its 50-day average, the longer trend points up too, and momentum is positive. If that continues, the price would be expected to head toward the anticipated high — though uptrends can reverse at any time.
BearishTrending down. The price is below its 50-day average, the longer trend points down, and momentum is negative. If that continues, the price would be expected to slide toward the anticipated low.
Oversold bounceBeaten down, possibly due for a bounce. RSI has dropped under 30, which often — not always — comes before a short-term rebound. A watch setup, not a buy signal.
Overbought riskRunning hot. RSI is above 70 after a fast run-up, so the stock may be due for a pause or pullback.
Neutral / MixedNo clear pattern. The signals point in different directions, so there is no trend to lean on right now. These rows honestly say “No clear pattern right now” instead of dressing up a range.
Anticipated high / low: for the leaning patterns, the row names the level the price would be expected to reach in about a week if the pattern plays out — the site's own words under it say it best: “An estimate based on how much the stock usually swings — not a promise or a prediction.” For a few stocks with wild daily swings, FinWhiz leaves the precise figure out and tells you to use the support and resistance levels instead.
Opening a row: “Profile & levels”
At the right of each row, tap Profile & levels to open that stock's detail. Inside you will find:
The plain-English explanation of that stock's pattern — the same wording as the pattern guide above, for that stock.
Its levels in numbers — the 50-day and 200-day averages (SMA50 / SMA200), its typical daily swing (ATR), and when it was first listed.
The company profile — what the company does in plain words, its sector and industry, headquarters, employee count, and official website, where a source provides them. Funds (ETFs and similar) are labeled as funds, not companies.
Short interest (FINRA) — how much of the stock traders are betting against, from FINRA's official figures, with a plain “short pressure estimate.” The block always dates itself, because official short interest is always a week or two old when published.
The Franchise Lens — for some stocks only; see section 5.
Two quicker ways to peek at a company: hover over (or tap) the ticker code itself for a small pop-up card with the profile, or tap the About / News button on the row. The About / News panel shows the profile plus a “See recent news” button that opens live Google News results for that company in a new tab — headlines move fast, so FinWhiz sends you to the live results instead of copying old ones.
Screen picture — a drawing of a real opened row, not a photo. Company details are made-up examples.
★ EXAMPLE — Example Foods, Inc.Bullish
Anticipated high (about a week, if the pattern plays out): $52.40 An estimate based on how much the stock usually swings — not a promise or a prediction.
Trending up. The price is above its 50-day average, the longer trend points up too, and momentum is positive.
SMA50: $48.10 · SMA200: $44.75 · ATR(14): 2.1% of price
Company profile — Example Foods, Inc. · Sector: Consumer Non-Durables · Industry: Packaged Foods
The Franchise Lens
Brand / habit moat A short note on what protects this company's business.
Pricing power: … Cash: a short list of cash facts from the company's own filings.
Fits: … Fails: … Durability: …
5. The Franchise Lens
Inside the Profile & levels detail of some stocks you will find an extra block called The Franchise Lens. It is a study aid that looks at the business behind the stock, instead of its price pattern. It covers 33 of the 1,000 stocks — if a stock has no lens, nothing extra appears, and that is normal.
For each covered stock, the lens shows:
Its moat — what (if anything) protects the company from competitors, named in a small label, with a plain explanation. Some honestly read as no moat that held.
Pricing power — whether the company has shown it can raise prices without losing its customers.
Cash facts — a short list of money facts drawn from the company's own public filings.
Fits / Fails — where the company fits a long-term quality checklist, and where it fails it.
Durability — how well the business looks built to last.
The lens changes rarely — it is reference reading, not daily data — and every lens block ends with its own note saying it is a study aid built from public filings, nobody's opinion of the company, and no substitute for your own judgment.
6. Coin Trends — the crypto page
FinWhiz's sister page, Coin Trends at crypto.finwhiz.us, reads the big crypto coins the same friendly way. It refreshes three times a day — 9 AM, 3 PM, and 7 PM Central — and every row shows the coin's price, its 1-day move, its trend pattern with a plain-English sentence, its RSI, its anticipated low and high, its bounce-off support and breakout resistance, and its 24-hour volume.
You read it just like a stock row: the pattern says which way the price has been leaning, RSI under 30 means beaten down and over 70 means overheated, and the anticipated low/high is the price plus and minus its typical daily swing. A coin with no clear pattern shows its jump-off levels without a dressed-up range. One warning from that page, word for word in spirit: crypto prices can move violently — never risk money you cannot afford to lose.
7. Email alerts — the honest status: coming soon
You will see two alert offers on FinWhiz, and both are coming soon — no alert emails are being sent yet. Here is exactly what each one does today:
“Get midday flip alerts” (the box on the home page). Type your email address and tap Join the list, and your place on the mailing list is saved. That is all that happens today — the emails start once sending is switched on. A “midday flip” means a tracked stock's price breaks its support or resistance level in the middle of the day; it is a signal, not a done deal, because a flip counts only if the price closes beyond the level.
The “Email alerts” and “Midday flip alerts” switches (in your account bar, when signed in). Turning one on saves your preference to your account, and the site tells you so in plain words: alert emails for your watched stocks will start going out once sending is switched on. If a switch cannot save yet, the site says so honestly in a message under the account bar — nothing is ever quietly pretended.
So: feel free to join the list and set your switches — your place and your choices are saved. Just please do not wait by your inbox yet. When the emails truly start, the wording on the site will change to say so.
8. One last, important note
⚠ Not financial advice. Everything on FinWhiz — patterns, ranges, jump-off levels, the Franchise Lens, and Coin Trends — is mechanical indicator data and public-filing facts, presented for education. None of it predicts the future, and none of it is a recommendation to buy, sell, or hold anything. Prices shown are post-close values from the data date; check a live price before acting on anything, and consider speaking with a licensed financial adviser about your own situation.
That's the whole tour — welcome to FinWhiz. The best way to learn it is to pick one stock you have heard of, search for it, and read its row top to bottom. It takes about a minute, and after that, every other row reads the same way.